From understanding papers and literature to expressing mechanisms, data, and motion. Explore reading notes, scientific visuals, and the materials and methods behind each handoff.
SELECTED VISUAL STUDIES
Complex research.
A clear visual story.
From tissue environments to cellular mechanisms, from source tables to research figures. Detail, depth, and a considered reading order give the work a clear form.
Browse the collection · Open a complete figure
B2R / MULTISCALE / GRAPHICAL ABSTRACTFIG. A
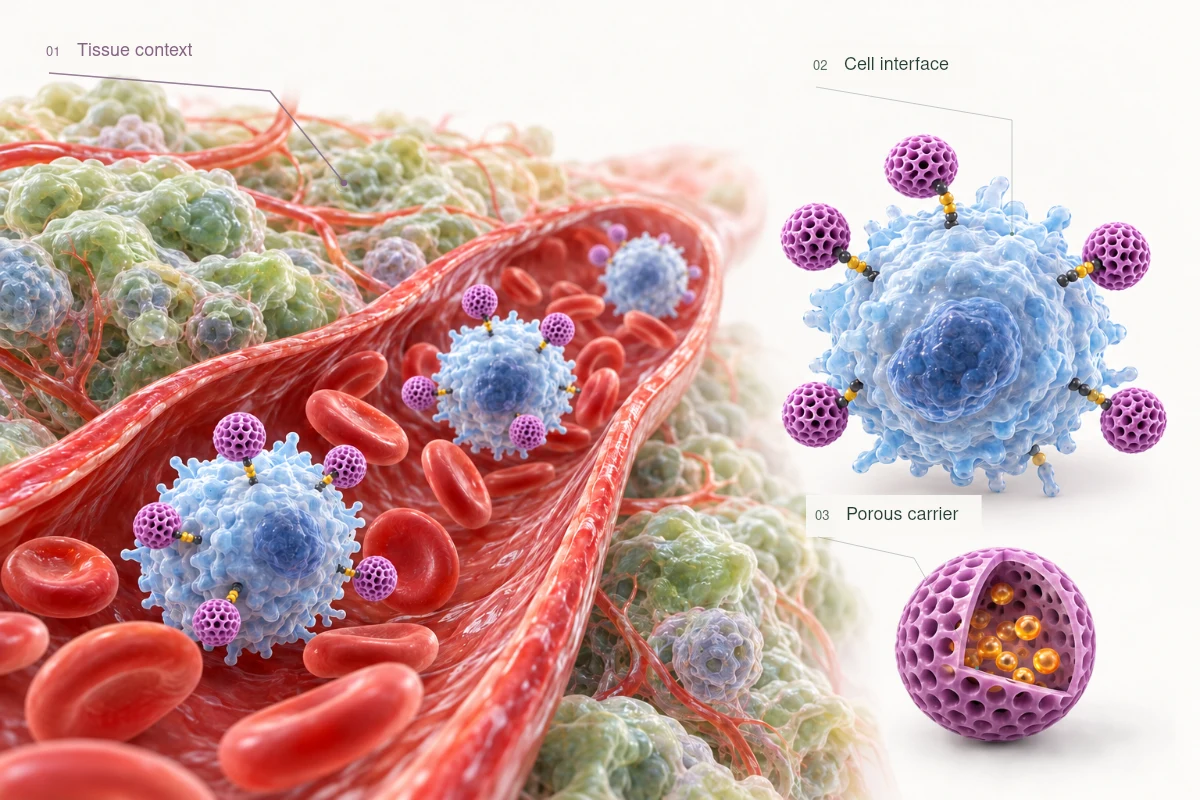
01Tissue context02Cell interface03Porous carrier
Establish the tissue context before moving into detail.
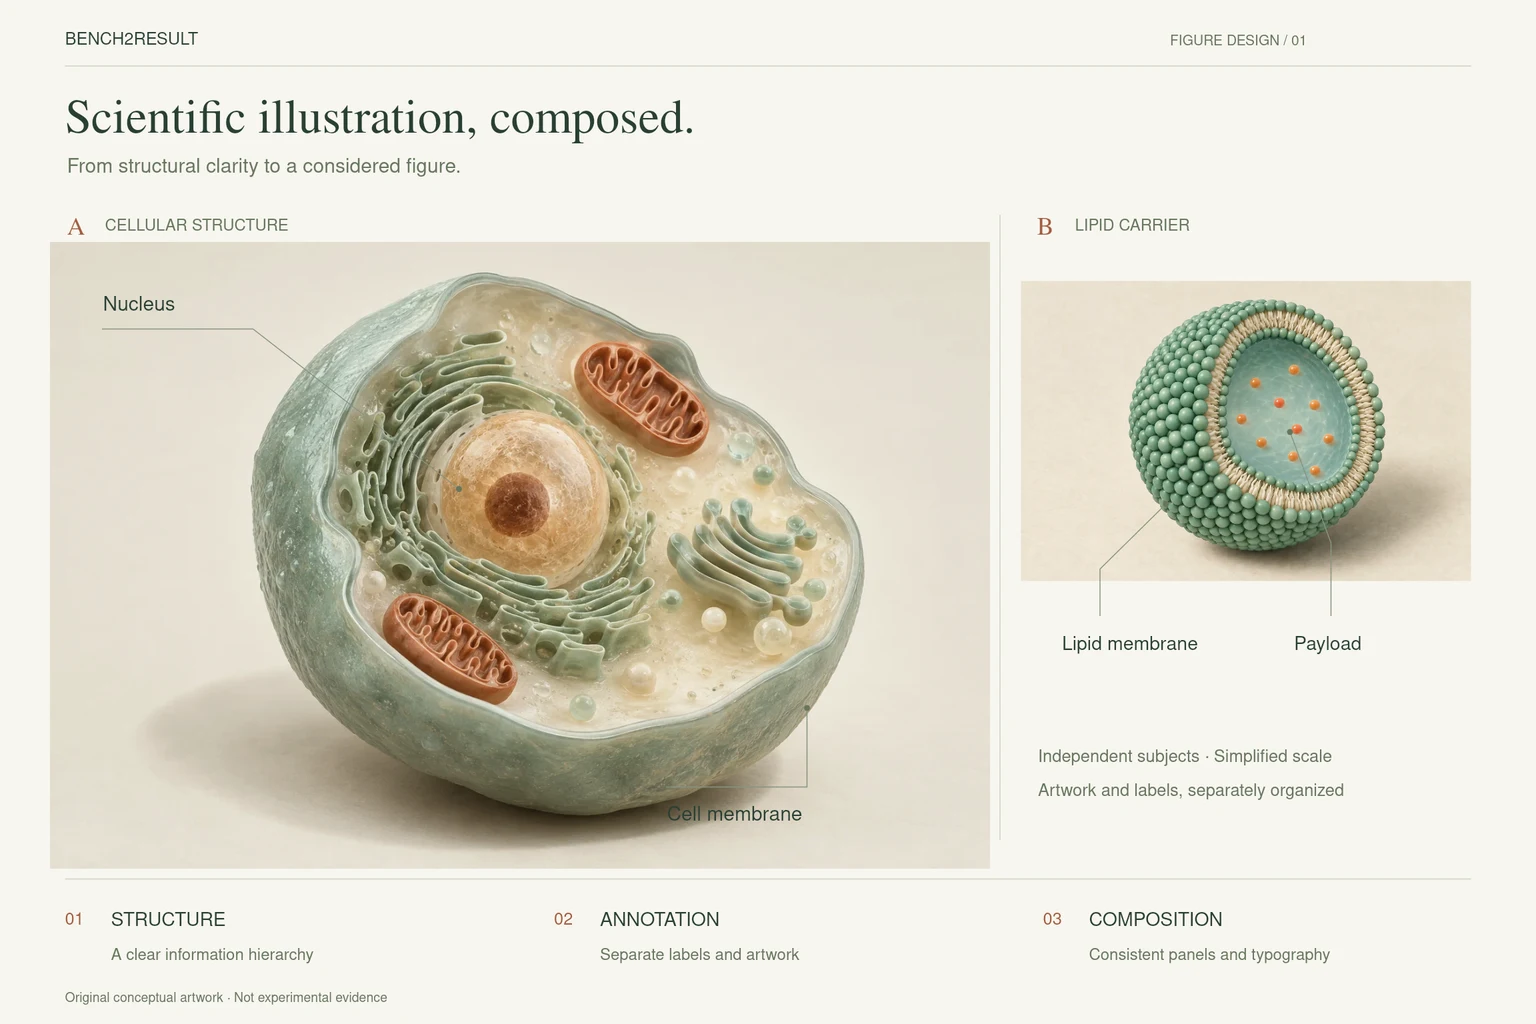
From tissue to cell to material.
Connect the tissue environment, cellular interface, and porous carrier in one composition, keeping the wider story and fine detail in view.
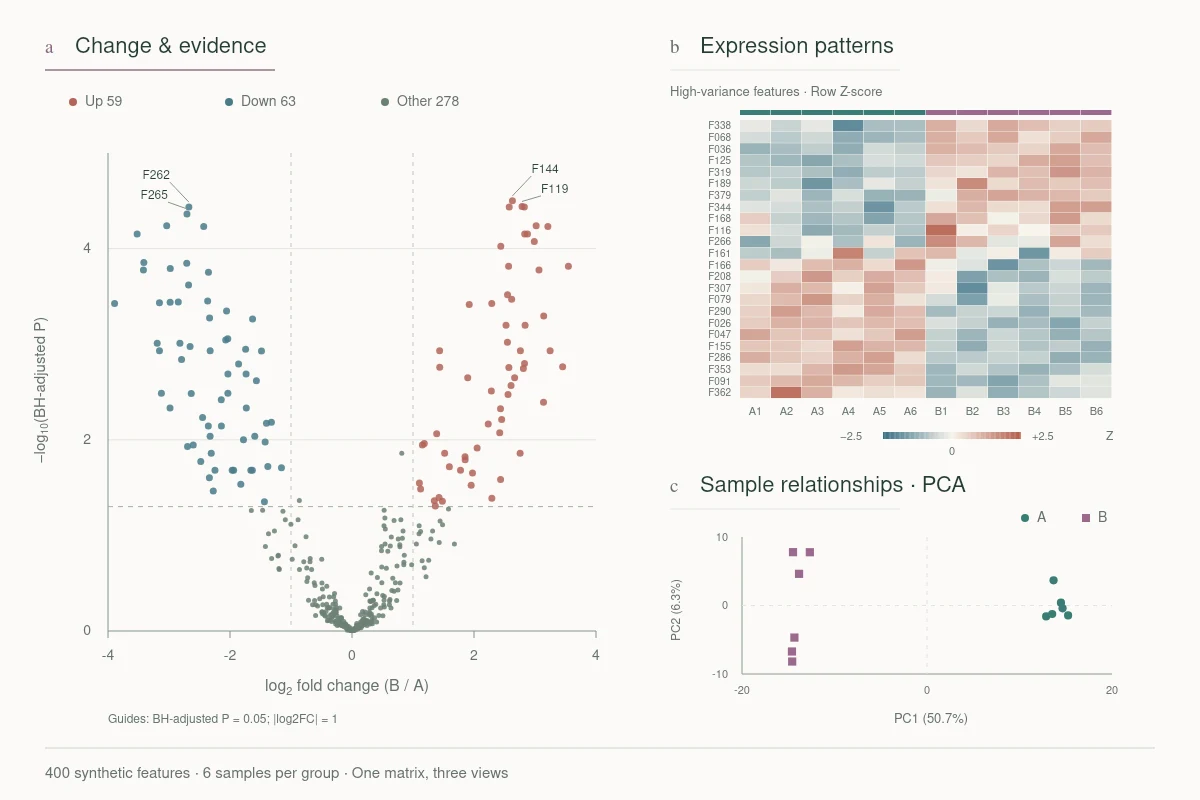
Show effect size alongside BH-adjusted statistical evidence.
Turn multiple views into one clear story.
Volcano, expression heatmap, and PCA views communicate changes, patterns, and sample relationships. Specialist analysis starts with a feasibility review.
Volcano plotExpression heatmapPCA · Feasibility first
01/05
Different research. The same clarity.
Original scientific visuals and synthetic-data figures illustrate the approach; they are not client projects or experimental results.
Paper reading, literature themes, figure analysis, and reading notes. Start with your question, separating the authors’ conclusions, supporting evidence, and unresolved points.
B2R / PAPER READING NOTES01 — 03
Jumper et al. / NATURE / 2021
AlphaFoldProtein structure prediction
01Question02Evidence03Boundaries
01
What is the research question?
How can protein structure be predicted from amino-acid sequence? Identify the task before tracing the validation.
SOURCE LOCATION / Abstract · Fig. 1
02
What supports the claim?
Predictions are evaluated in CASP14 and on later structures. pLDDT estimates local prediction reliability.
SOURCE LOCATION / Fig. 1–2 · Results
03
Where does the evidence stop?
Shallow alignments and dependence on other-chain contacts affect predictions. Structure accuracy alone does not validate function or drug efficacy.
Structured paper reading, methods and figure reasoning, comparisons across papers, journal-club notes, and question lists. Specialist areas and systematic reviews require separate assessment.
What to prepare
Papers or accessible source links, a reference list, your questions, and whether the work supports a journal club, project discussion, or later visualization.
What the handoff can include
Structured notes, evidence locations, comparison tables, and open questions. References and analytical inferences are distinguished and traceable.
What is the research question?
How can protein structure be predicted from amino-acid sequence? Identify the task before tracing the validation.
Abstract · Fig. 1
What supports the claim?
Predictions are evaluated in CASP14 and on later structures. pLDDT estimates local prediction reliability.
Fig. 1–2 · Results
Where does the evidence stop?
Shallow alignments and dependence on other-chain contacts affect predictions. Structure accuracy alone does not validate function or drug efficacy.
Fig. 5 · MSA depth and cross-chain contacts
Public-paper reading notes, not client work. Source: Jumper et al., Highly accurate protein structure prediction with AlphaFold. Nature 596, 583–589 (2021). The distinction between structure accuracy and functional or drug validation is a reading-boundary note; this work does not evaluate efficacy or reproduce the experiments.
Give research a clear visual hierarchy across molecular, cellular, pharmacological, immunological, and disease-mechanism topics. Relationships must follow the evidence you provide.
Conceptual mechanism · No audio · Not a specific pathway
2.5D mechanism storytelling
Recognition, binding, and signalling unfold in order. Spatial layers, annotations, and pacing organize the reading for research presentations and mechanism communication.
From evidence to a playable figure
Confirm the mechanism and storyboard before developing still and motion layers. MP4, key frames, and agreed source files can form the handoff; editability is specified separately.
About this work
A generic ligand–receptor concept, not a specific protein or experimentally established pathway. The ligand remains extracellular; intracellular signalling is represented by a visual cue.
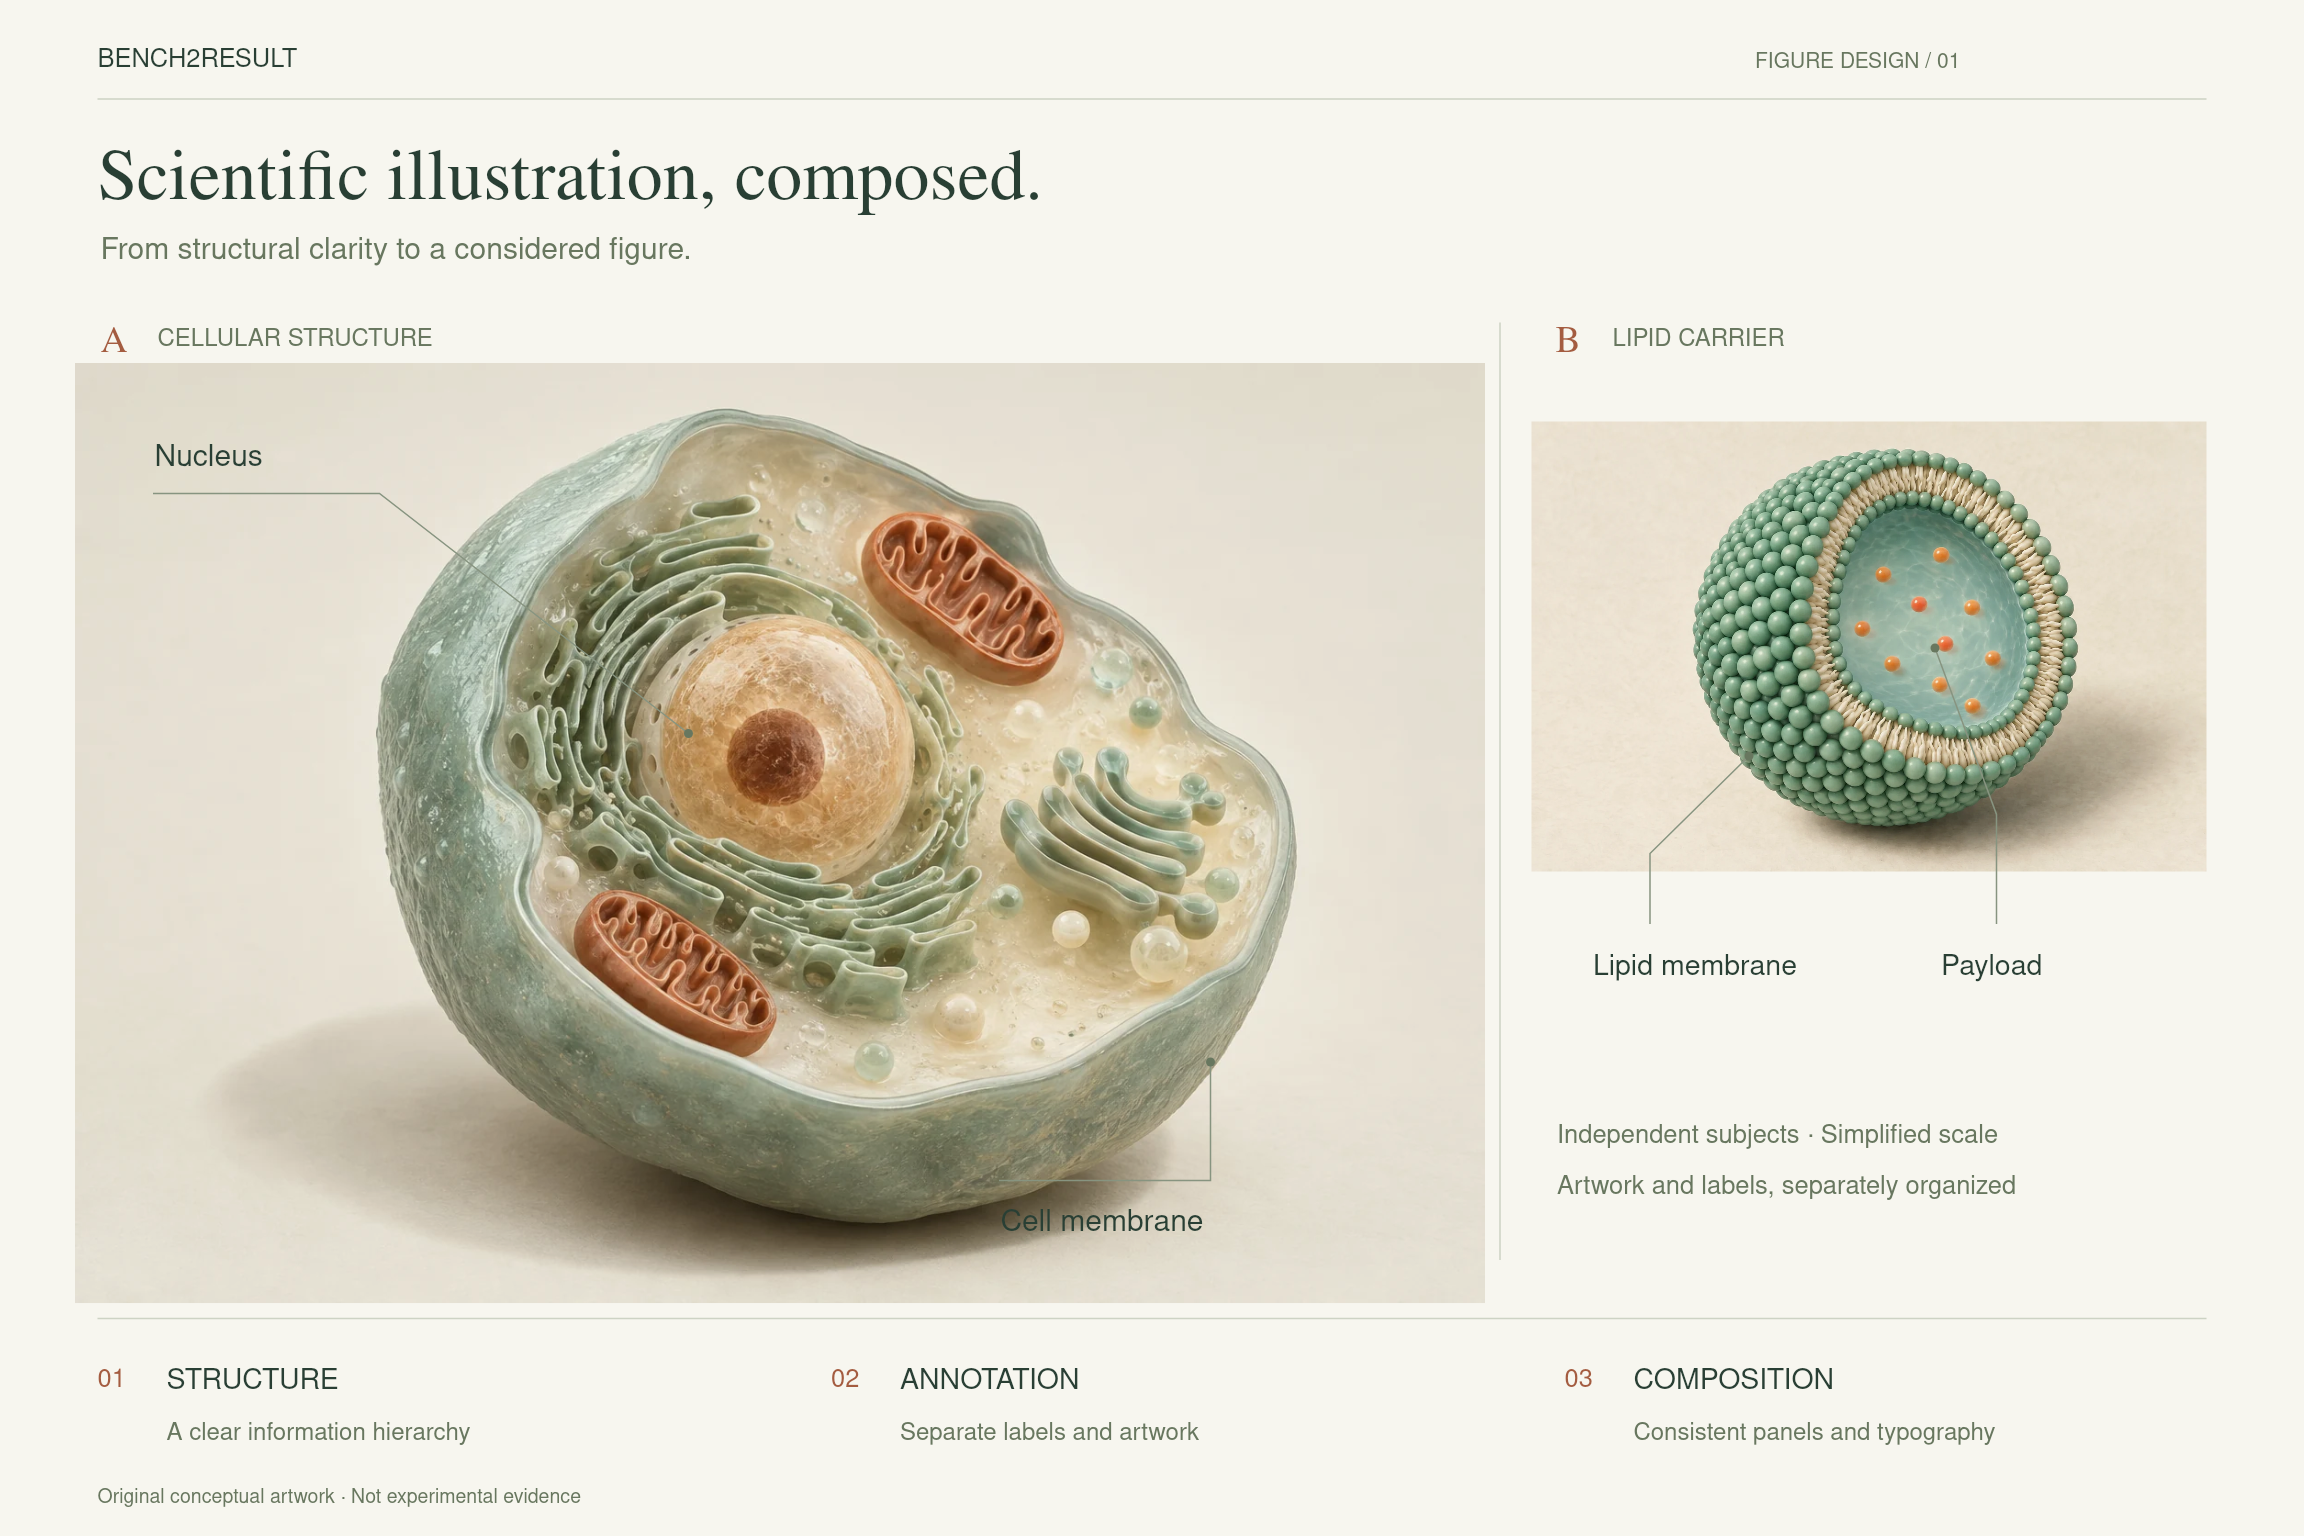
Original AI-assisted conceptual artwork, composed and annotated as independent cell and lipid-carrier subjects. No experimentally established interaction is implied. Forms and scale are simplified; project-specific mechanisms need evidence-based review. The base artwork is raster; text and vector layers are delivered as agreed.
What you can commission
Mechanism diagrams, graphical abstracts, conceptual cellular and drug-carrier artwork, multi-panel figure assembly, and consistent styling across existing figures.
What to prepare
The research objective, relationships and supporting references, sketches or existing figures, and the intended publication or presentation format.
What the handoff can include
High-resolution artwork and composed figures, with separate text, vector objects, and source files as agreed. Embedded raster artwork is not an editable 3D model; editability is defined before work begins.
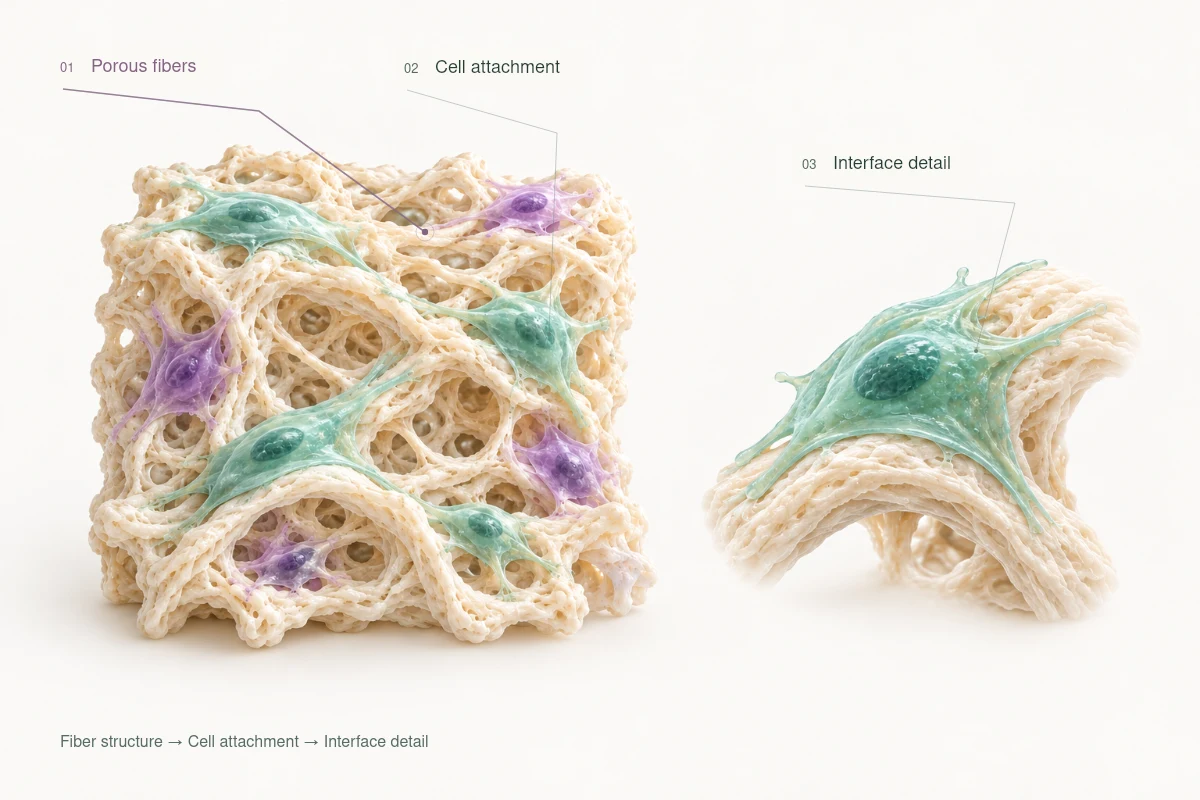
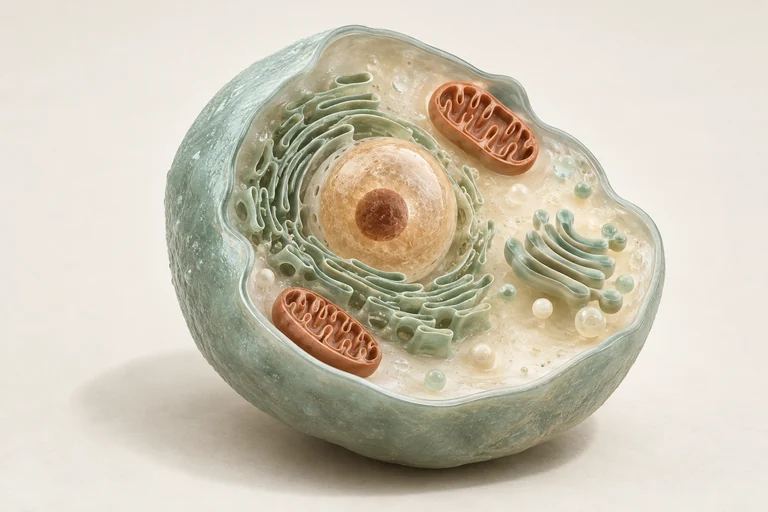
Cell cutaways, intracellular structures, annotations, and figure layouts. Cell types and structural details are reviewed against project-specific evidence.
Original AI-assisted conceptual cell illustration. Forms and proportions are simplified artistically; it does not identify a cell type or establish a mechanism. Project-specific figures require literature-based and researcher review.
Drug carriers & structural visuals
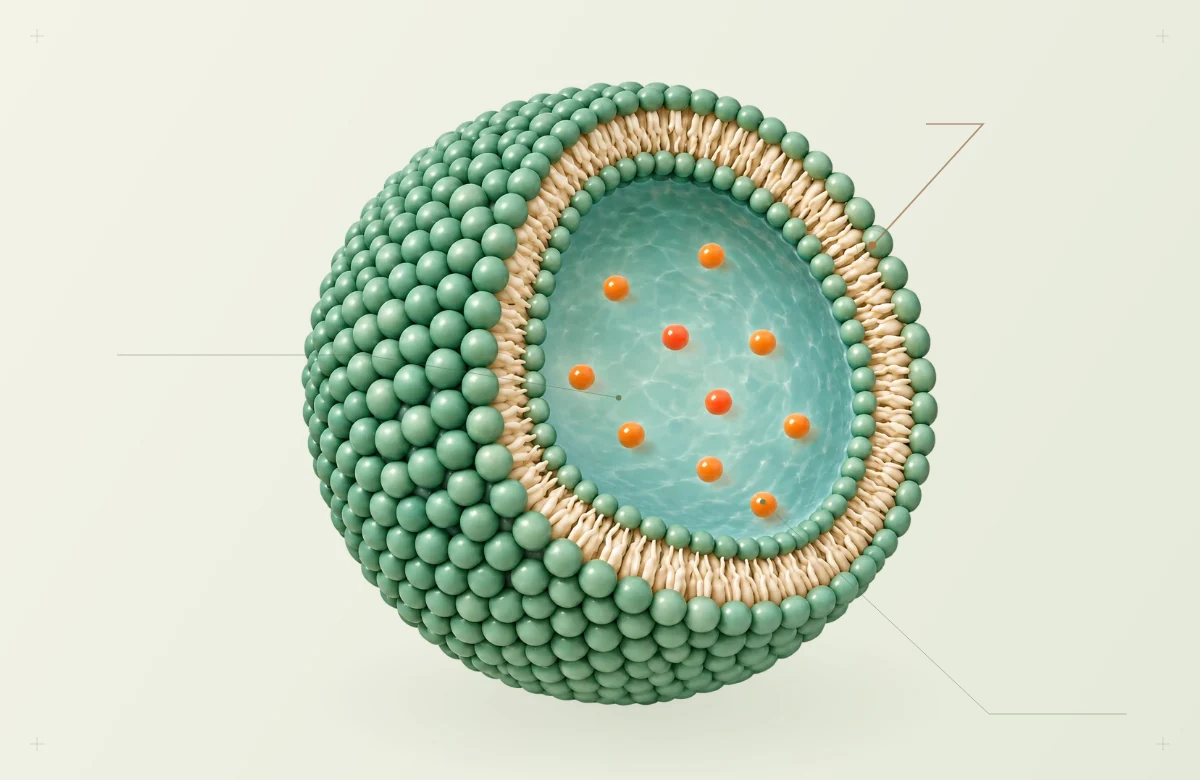
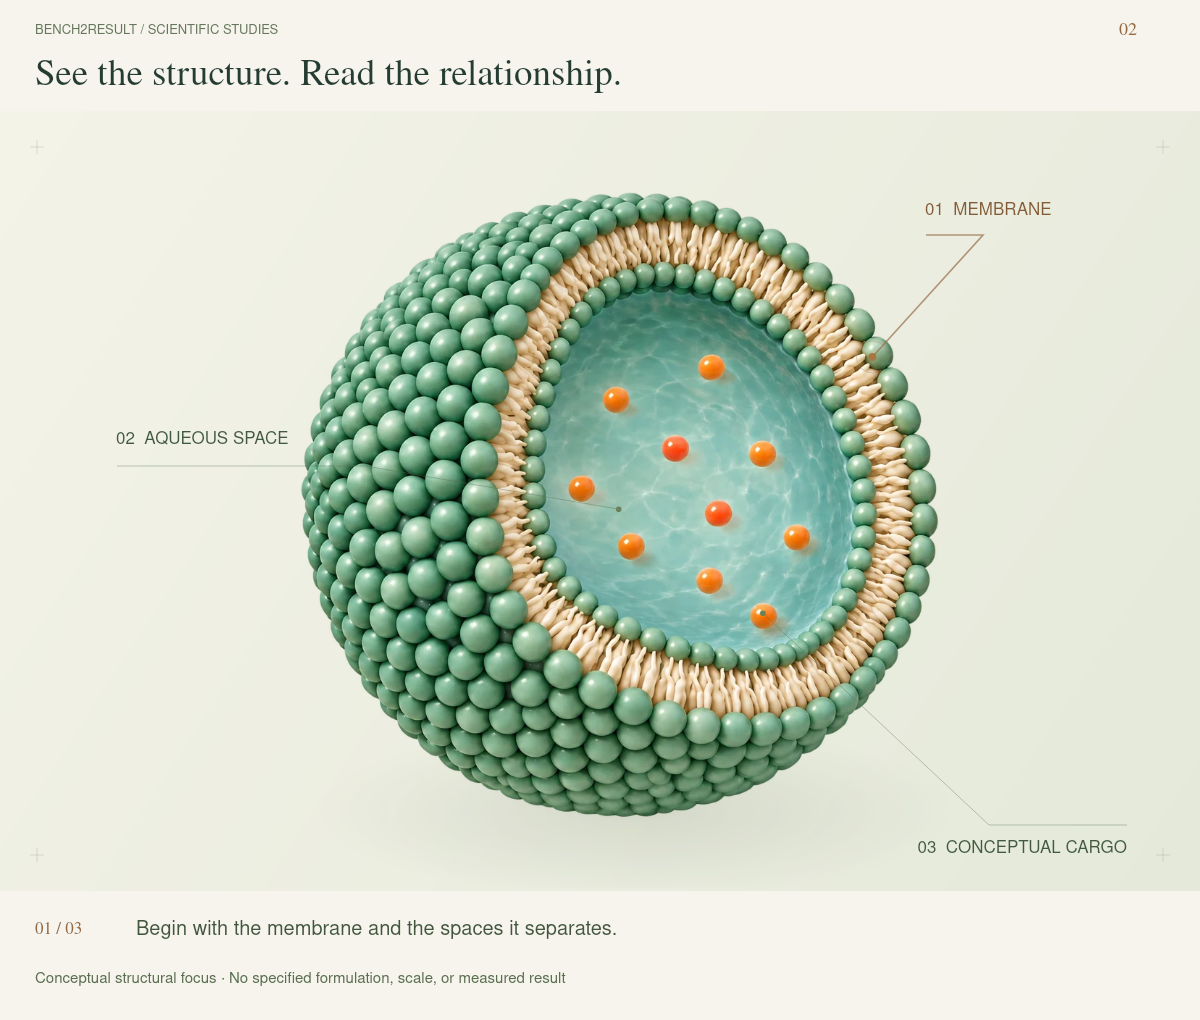
Spatial relationships among the carrier, membrane, and payload. Formulation, scale, and interactions must come from the actual research.
B2R / MATERIALS & DRUG-RESEARCH VISUALSSTUDY 02
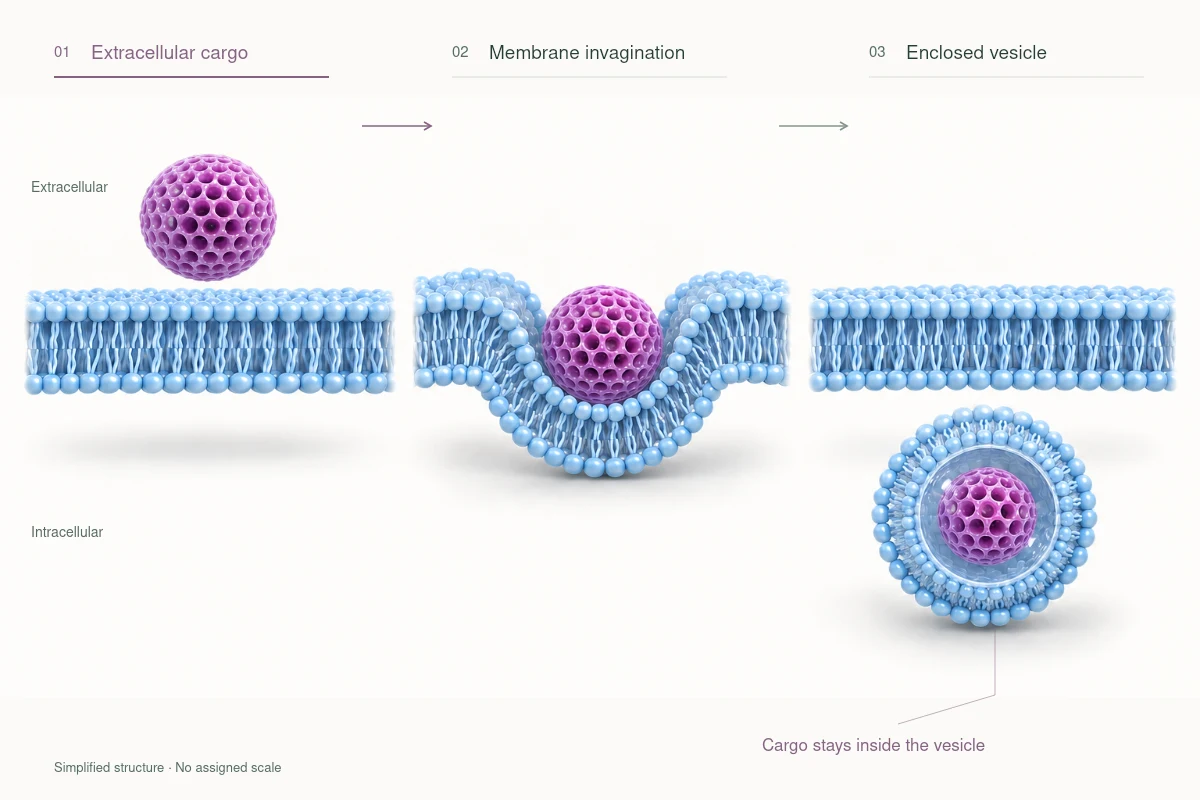
01MEMBRANE02AQUEOUS SPACE03CONCEPTUAL CARGO
01 / 03
Begin with the membrane and the spaces it separates.
Conceptual structural focus · No specified formulation, scale, or measured result
Artwork notes & provenance
Original AI-assisted lipid-nanocarrier concept. It represents no specific formulation, drug, scale, or measured result. Fine connections are artistically simplified, not a molecularly precise model. This artwork is a raster asset.
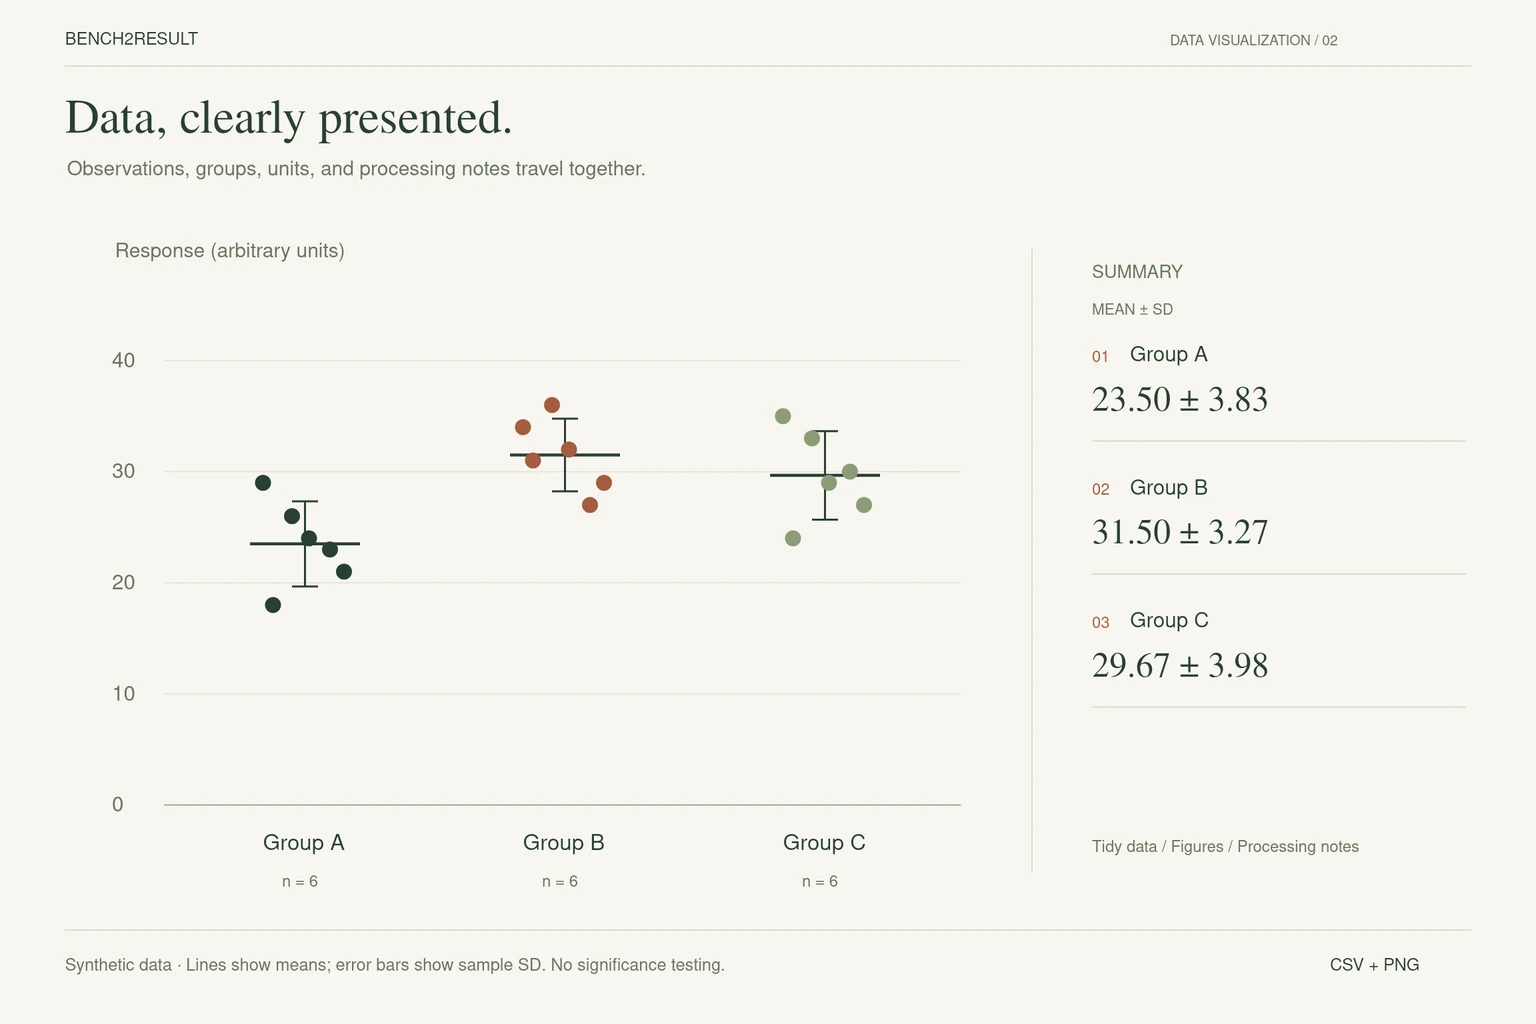
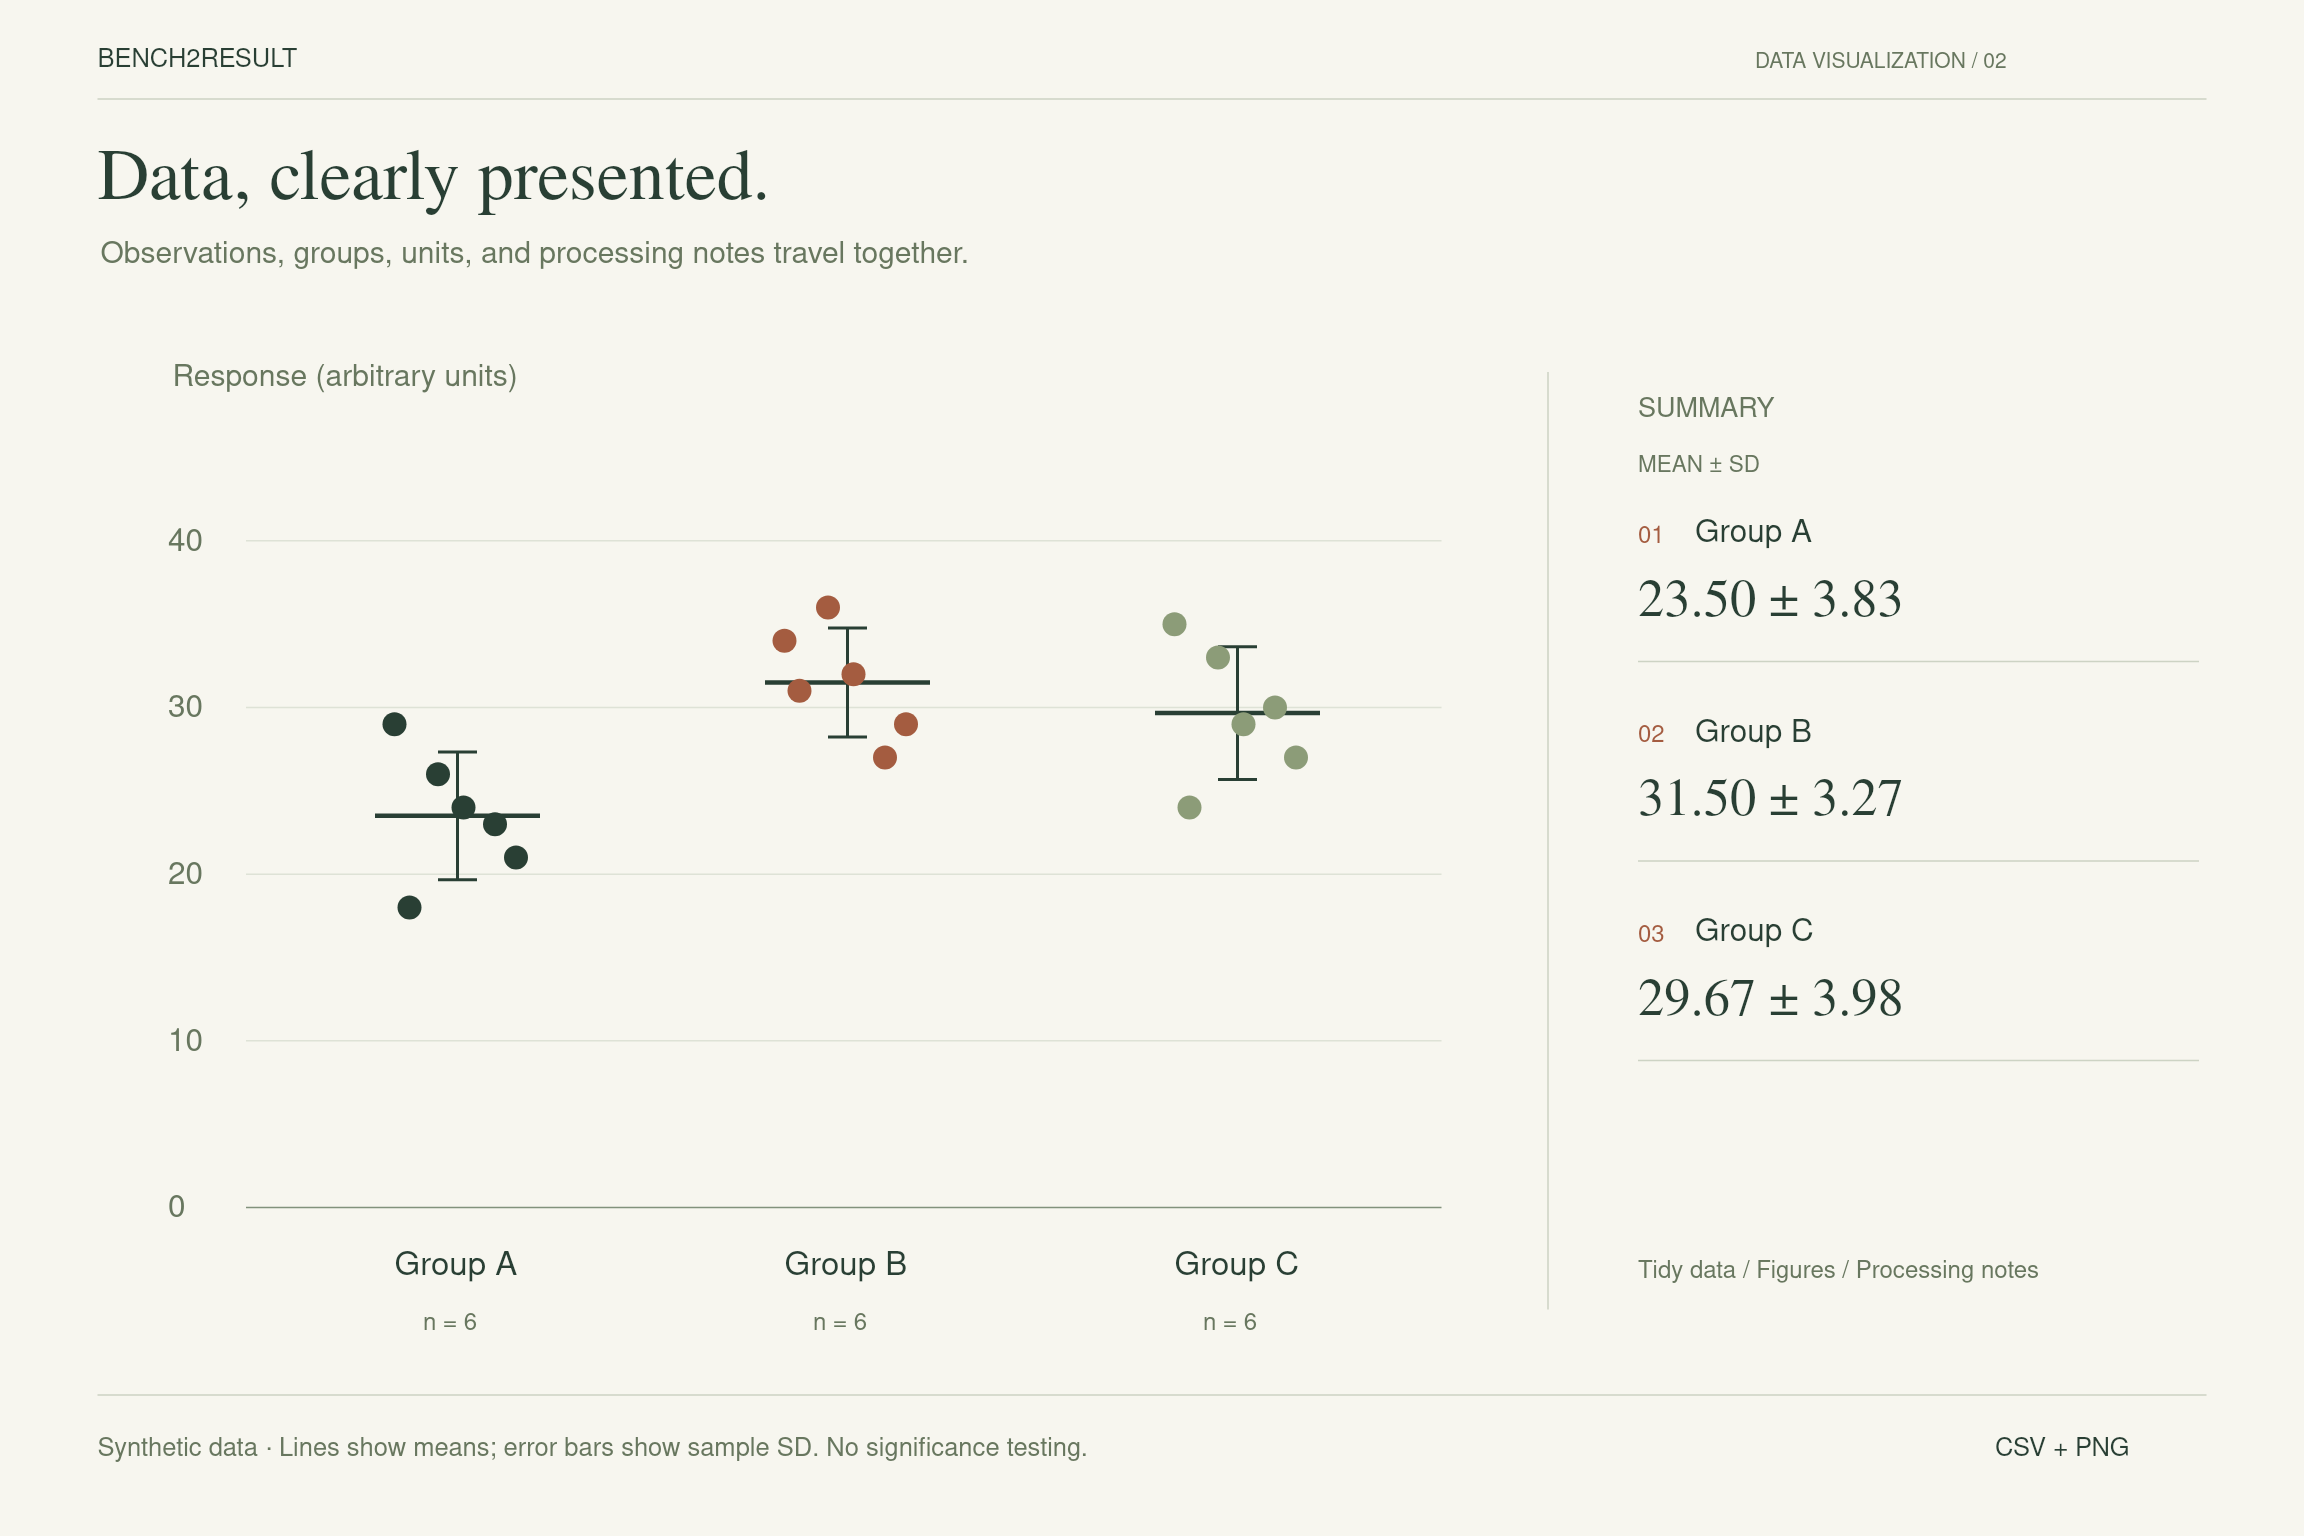
From data cleaning and group checks to figure assembly, keep the files useful beyond the first export. Statistical methods depend on study design, replicate type, and the data.
OBSERVATIONS, GROUPS & FIGURESCSV + PNG
What you can commission
Experimental-table cleanup, sample and group checks, missing-value records, descriptive plots, consistent legends and units, figure assembly, and processing documentation.
What to prepare
Original data and its dictionary, sample IDs, groups, replicate types, units, study design, and any existing analysis method.
What the handoff can include
Tidy tables, figure files, and calculation notes. Reproducible scripts are provided where feasible and agreed; filtering and exclusion decisions are documented.
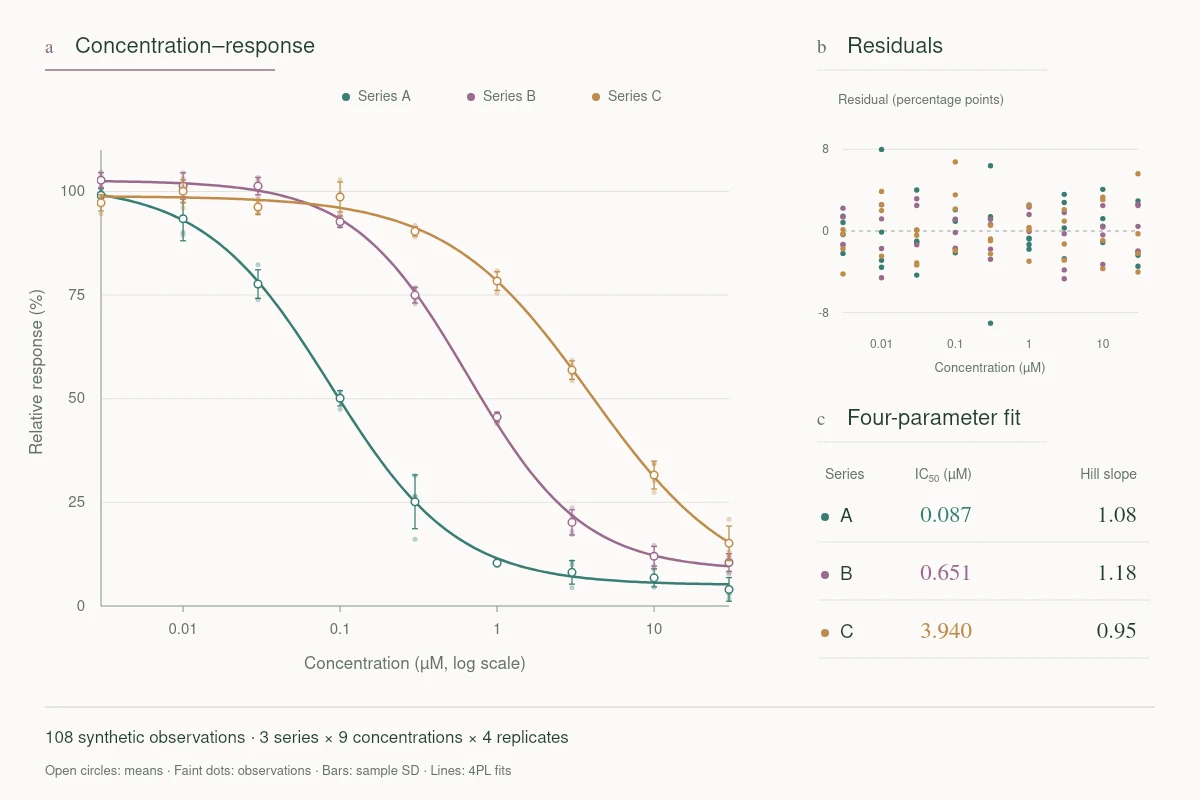
This figure uses synthetic data to explain the handoff format, not real experiments or client projects. Each group has six observations; means and sample SDs are calculated from the same CSV. Replicate types are unspecified; no significance testing or scientific inference is performed.
ADDITIONAL SUPPORT / IMAGE QUANTIFICATION
From WB images to reviewable results.
Follow the relationship between images, ROI review, and normalized outputs. The WB workflow has been tested internally; challenging material still needs manual review. Other image tasks are assessed first.
WB ANALYSIS · PROCESS RECORDSIMULATED
01 Materials02 Review & process03 Deliverables
A1A2A3B1B2B3
Target
Control
SIMULATED MATERIAL6 samples · 2 groups
Start with the original context
Confirm groups, target/control pairing, and whether the images are suitable for quantification.
Simulated measurements and normalization calculations
Sample
Corrected target
Corrected control
Target / control
Relative to A mean
A1
12,000
20,000
0.6000
0.9908
A2
13,800
22,000
0.6273
1.0358
A3
11,200
19,000
0.5895
0.9734
B1
19,800
21,000
0.9429
1.5569
B2
18,600
20,000
0.9300
1.5357
B3
21,600
23,000
0.9391
1.5508
Calculation: each ROI is assigned an area of 100 pixels and a mean background of 30 arbitrary units per pixel, giving an integrated background of 3,000. The corrected target/control ratio is divided by the mean ratio for group A. Each point is a simulated sample; replicate types are unspecified and no inferential statistics are applied. The illustrated bands are not used in the calculation.