
Demo data and calculation methods
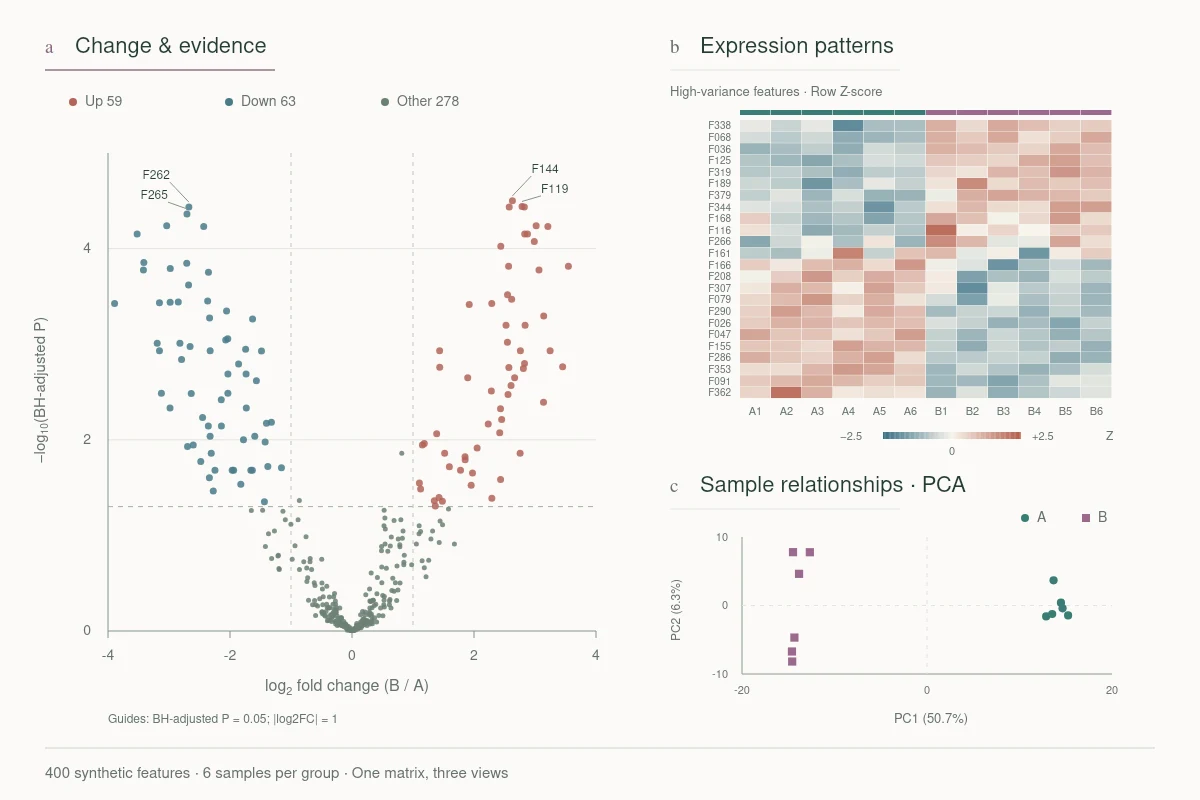
The homepage volcano plot, heatmap and PCA share one synthetic 400 × 12 expression matrix. These methods describe the displayed calculations. All data is illustrative and does not represent experimental findings.
Input: one expression matrix
The random seed is 20261010. The matrix contains 400 abstract features and 12 samples: six each in groups A and B. Values are already normalized log₂ expression, not raw RNA-seq counts. Features do not identify real genes or pathways.
Volcano plot: change and evidence
A two-sided Welch t-test compares the groups for each feature, followed by Benjamini–Hochberg (BH) multiple-testing correction. The x-axis is log₂FC: the group B mean minus the group A mean. The y-axis is −log₁₀(BH-adjusted P). Color requires both BH-adjusted P < 0.05 and |log₂FC| ≥ 1.
Heatmap: expression patterns
Select the 24 features with the highest variance. Calculate row Z-scores using the sample standard deviation. Cluster rows with Euclidean distance and average linkage; keep columns in A/B group order. Clamp the color scale to −2.5 through +2.5.
PCA: sample relationships
Use all 400 features. Center each feature without variance scaling, then use singular value decomposition (SVD) to calculate principal components and explained variance. Axes show PC1 and PC2; percentages report the variance explained by each component.
How to read the demonstration
All three views use the same synthetic matrix to show changes, expression patterns and sample relationships. They demonstrate figure production, not biological findings. No DESeq2, UMAP or pathway enrichment analysis was performed.
Also: the dose–response example
The archived dose–response figure also uses synthetic data: three groups × nine concentrations × four replicates, totaling 108 values. Concentration is in μM on a log axis. An unweighted least-squares fit uses a four-parameter inhibitory logistic model:
Bottom + (Top − Bottom) / (1 + (c / IC50)^Hill)
IC50 is the concentration at the midpoint of the fitted plateaus, not necessarily a raw response of 50%. Error bars show sample SD. Residuals are observed minus fitted response in percentage points. No confidence intervals or efficacy claims are provided.